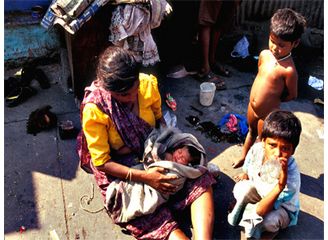
Although the middle class has gained from recent positive economic developments, India still suffers from substantial poverty. The Planning Commission, which is the nodal official agency for poverty estimation, has estimated that 27.5% of the population was living below the poverty line in 2004–2005, down from 51.3% in 1977–1978, and 36% in 1993-1994. The source for this was the 61st round of the National Sample Survey (NSS) and the criterion used was monthly per capita consumption expenditure below Rs. 356.35 for rural areas and Rs. 538.60 for urban areas. 75% of the poor are in rural areas with most of them comprising daily wagers, self-employed households and landless labourers.
Causes of poverty in India
The proportion of India's population below the poverty line has fluctuated widely in the past, but the overall trend has been downward. However, there have been roughly three periods of trends in income poverty.
1950 to mid-1970s: Income poverty reduction shows no discernible trend. In 1951, 47% of India's rural population was below the poverty line. The proportion went up to 64% in 1954-55; it came down to 45% in 1960-61 but in 1977-78, it went up again to 51%.
Mid-1970s to 1990: Income poverty declined significantly between the mid-1970s and the end of the 1980s. The decline was more pronounced between 1977-78 and 1986-87, with rural income poverty declining from 51% to 39%. It went down further to 34% by 1989-90. Urban income poverty went down from 41% in 1977-78 to 34% in 1986-87, and further to 33% in 1989-90.
After 1991: This post-economic reform period evidenced both setbacks and progress. Rural income poverty increased from 34% in 1989-90 to 43% in 1992 and then fell to 37% in 1993-94. Urban income poverty went up from 33.4% in 1989-90 to 33.7% in 1992 and declined to 32% in 1993-94 Also,NSS data for 1994-95 to 1998 show little or no poverty reduction, so that the evidence till 1999-2000 was that poverty, particularly rural poverty, had increased post-reform. However, the official estimate of poverty for 1999-2000 was 26.1%, a dramatic decline that led to much debate and analysis. This was because for this year the NSS had adopted a new survey methodology that led to both higher estimated mean consumption and also an estimated distribution that was more equal than in past NSS surveys. The latest NSS survey for 2004-05 is fully comparable to the surveys before 1999-2000 and shows poverty at 28.3% in rural areas, 25.7% in urban areas and 27.5% for the country as a whole. Thus, poverty has declined after 1998, although it is still being debated whether there was any significant poverty reduction between 1989-90 and 1999-00. The latest NSS survey was so designed as to also give estimates roughly, but not fully, comparable to the 1999-2000 survey. These suggest that most of the decline in rural poverty over the period during 1993-94 to 2004-05 actually occurred after 1999-2000.
In summary, the official poverty rates recorded by NSS are:
Historical trends in poverty statistics
Since the early 1950s, government has initiated, sustained, and refined various planning schemes to help the poor attain self sufficiency in food production. Probably the most important initiative has been the supply of basic commodities, particularly food at controlled prices, available throughout the country as poor spend about 80 percent of their income on food.
Programmes like Food for work and National Rural Employment Programme have attempted to use the unemployed to generate productive assets and build rural infrastructure.
 Controversy over extent of poverty reduction
No comments:
Post a Comment